Multiple Choice
Graph 8-2 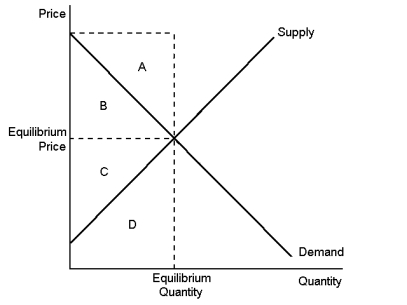 This graph shows supply and demand in a free market.
-According to Graph 8-2, if the market is in equilibrium, consumer surplus is represented by area:
A) A
B) B
C) C
D) D
Correct Answer:
Verified
Related Questions
Q47: Graph 8-1 Q48: Graph 8-1 Q49: Graph 8-1 Q50: Graph 8-1 Q51: Graph 8-1 Q53: When a tax is levied on the Q54: A tax levied on the supplier of Q55: Graph 8-1 Q56: A tax levied on the buyers of Q57: Graph 8-1 Unlock this Answer For Free Now! View this answer and more for free by performing one of the following actions Scan the QR code to install the App and get 2 free unlocks Unlock quizzes for free by uploading documents![]()
![]()
![]()
![]()
![]()
![]()
![]()

