Graph 7-2 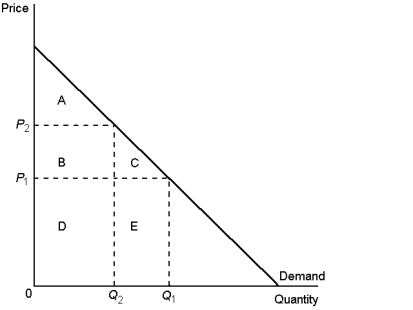
-According to Graph 7-2, area C represents:
A) the decrease in consumer surplus that results from a downward-sloping demand curve
B) consumer surplus to new consumers who enter the market when the price falls from P₂ to P₁
C) an increase in producer surplus when the quantity sold increases from Q₂ to Q₁
D) a decrease in consumer surplus to each consumer in the market
Correct Answer:
Verified
Q81: Welfare economics is the study of:
A)how the
Q82: Normative analysis refers to what:
A)is
B)should be
C)maximises efficiency
D)is
Q83: Producer surplus equals:
A)value to buyers - amount
Q84: Suppose consumer income increases.If wine is a
Unlock this Answer For Free Now!
View this answer and more for free by performing one of the following actions

Scan the QR code to install the App and get 2 free unlocks

Unlock quizzes for free by uploading documents