Graph 7-3 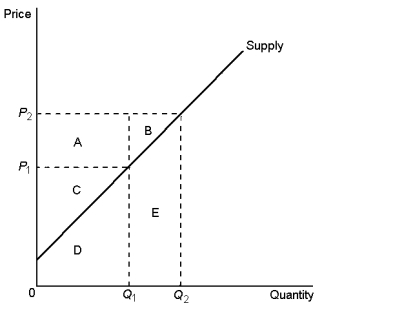
-According to Graph 7-3, area B represents:
A) producer surplus to new producers entering the market as the result of price rising from P₁ to P₂
B) the increase in consumer surplus that results from an upward-sloping supply curve
C) a decrease in producer surplus to each producer in the market
D) an increase in total surplus when sellers are willing and able to increase supply from Q₁ to Q₂
Correct Answer:
Verified
Q65: Producer surplus is the area
A)under the supply
Q110: Producer surplus measures all of the following
Q111: Graph 7-3 Q112: Costa and Soula sell lemonade on the Q113: Producer surplus is the: Q114: If Dale sells a shirt for $80 Q116: Table 7-2 Q117: Table 7-2 Q118: Which of the following would be true Q119: Graph 7-3 ![]()
A)amount represented by the
The costs of five possible
The costs of five possible![]()
Unlock this Answer For Free Now!
View this answer and more for free by performing one of the following actions

Scan the QR code to install the App and get 2 free unlocks

Unlock quizzes for free by uploading documents