Graph 2-1 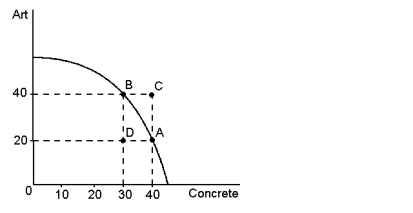
-Refer to Graph 2-1.In the graph shown, points A, B and D represent efficient outcomes for society.
Correct Answer:
Verified
Q9: An economy will always operate at some
Q18: Scientific models are designed to simplify reality
Q21: Microeconomics is the study of decision making
Q22: The circular-flow diagram and the production possibilities
Q24: Australia harvests five to seven million kangaroos
Q26: The efficient production points for the production
Q27: Governments hire economic advisers because they know
Q201: An economy is being efficient if it
Q212: In the markets for goods and services,
Q218: In a simple circular-flow diagram, the two
Unlock this Answer For Free Now!
View this answer and more for free by performing one of the following actions

Scan the QR code to install the App and get 2 free unlocks

Unlock quizzes for free by uploading documents