The graph below shows a plot of angular acceleration in rad/s2 versus time from t = 0 s to t = 8 s. The change in angular velocity, Δω, during this 8-second period is 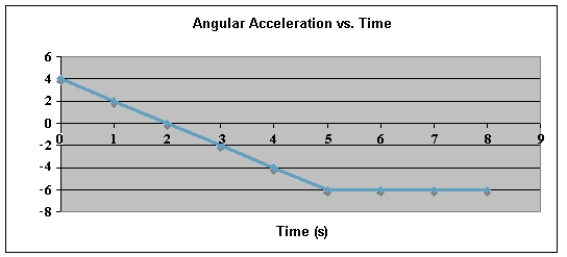
A)  , CW.
, CW.
B)  , CCW.
C)  , CW.
, CW.
D)  , CCW.
E)  , CW.
, CW.
Correct Answer:
Verified
Q21: Particles (mass of each = 0.40 kg)
Q25: A uniform rod (length = 2.0 m)
Q28: Identical particles are placed at the 50-cm
Q39: Two forces of magnitude 50 N, as
Q42: The angular speed of the minute hand
Q43:
The figure below shows a graph of
Q44: Exhibit 12-2
The figure below shows a graph
Q45: You throw a Frisbee of mass m
Q46:
The figure below shows a graph of
Q67: A small sphere attached to a light
Unlock this Answer For Free Now!
View this answer and more for free by performing one of the following actions

Scan the QR code to install the App and get 2 free unlocks

Unlock quizzes for free by uploading documents