Services
Discover
Question 29
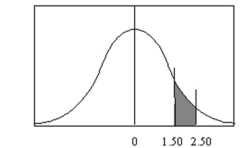
In the figure below, what is the area under the curve between z=1.50 and z=2.50?\text { In the figure below, what is the area under the curve between } z = 1.50 \text { and } z = 2.50 ? In the figure below, what is the area under the curve between z=1.50 and z=2.50?
A) 0.0802B) 0.0606C) 0.0764D) 1.00
Correct Answer:
Verified
Unlock this answer nowGet Access to more Verified Answers free of charge
Q24: For a normal distribution with mean 4
Q25: Give the term for the number of
Q26: Q27: Q28: Find the probability Q30: Q31: What is the special property of theQ32: Given the normal distribution curve shownQ33: Using the normal distribution curve shownQ34: Find the probability Unlock this Answer For Free Now!View this answer and more for free by performing one of the following actionsScan the QR code to install the App and get 2 free unlocksMaximize QR codeUnlock quizzes for free by uploading documentsUpload documents
Q27: Q28: Find the probability Q30: Q31: What is the special property of theQ32: Given the normal distribution curve shownQ33: Using the normal distribution curve shownQ34: Find the probability
Q28: Find the probability
Q30: Q31: What is the special property of theQ32: Given the normal distribution curve shownQ33: Using the normal distribution curve shownQ34: Find the probability
Q31: What is the special property of the
Q32: Given the normal distribution curve shown
Q33: Using the normal distribution curve shown
Q34: Find the probability
Unlock this Answer For Free Now!
View this answer and more for free by performing one of the following actions
Scan the QR code to install the App and get 2 free unlocks
Unlock quizzes for free by uploading documents