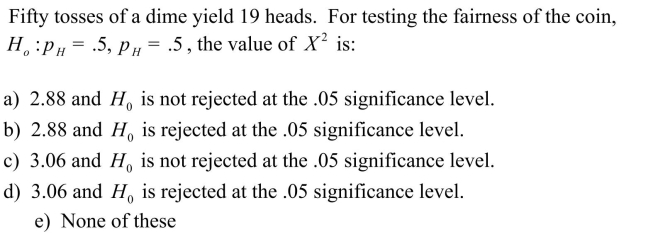
Not Answered
 The scatterplot below is from an analysis of the number species of fish present and the acidity (pH)of 15 randomly selected rivers in New England.
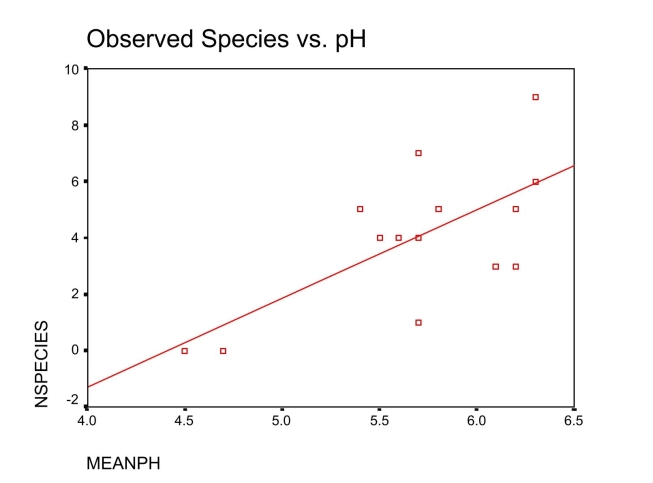
Correct Answer:
Verified
Related Questions
Q97: Suppose that x has a probability distribution
Q98: Which of the following is true:
Q99: Use the following information for questions
One
Q100: A huge trucking firm determines that its
Q101: Which of the following is not a
Q103: Inspection of the scatter plot above seems
Unlock this Answer For Free Now!
View this answer and more for free by performing one of the following actions

Scan the QR code to install the App and get 2 free unlocks

Unlock quizzes for free by uploading documents