The table shows the average daily high temperatures in Houston H (in degrees Fahr- enheit) for month t, with corresponding to January.
Select the correct scatter plot from the above data.
A) 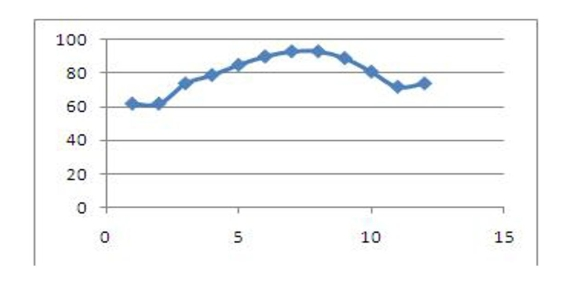
B) 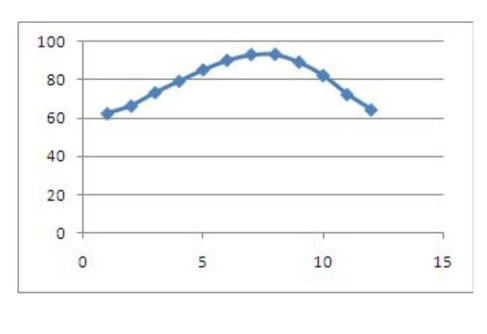
C) 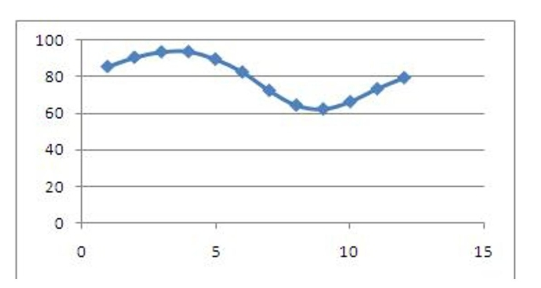
D) 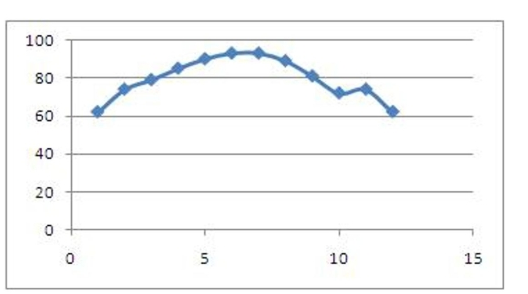
E) 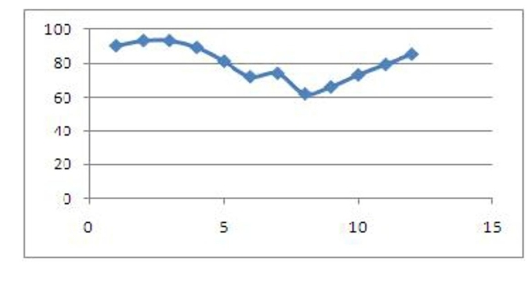
Correct Answer:
Verified
Q49: Perform the multiplication and use the
Q50: Use the given values to evaluate
Q51: Use the formula
Q52: Simplify the expression algebraically.
Q53: Use the trigonometric substitution to select
Q55: Use the law of Cosines to
Q56: Find all solutions of the following
Q57: Find the rate of change of
Q58: Evaluate the expression.
Q59: Use the sum-to-product formulas to select
Unlock this Answer For Free Now!
View this answer and more for free by performing one of the following actions

Scan the QR code to install the App and get 2 free unlocks

Unlock quizzes for free by uploading documents