The Des Moines Register article in problem #2 also reported the percent of children eligible for Free and Reduced lunch to teacher experience. The percent of children eligible for Free/Reduced lunch is an indicator of the socio economic status of a neighborhood. The Register was concerned that less experienced teachers typically teach students from lower-income families. The accompanying scatter plot displays the data from the article. 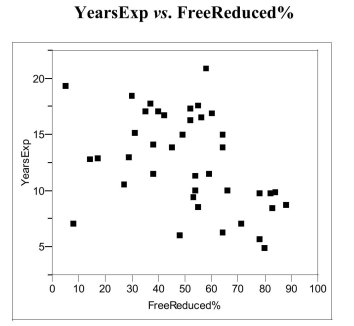
(a) If lesser experienced teachers typical ly teach students from low-income families,
what sort of trend or pattern should appear in the scatter plot?
(b) Does this trend or pattern emerge in these data? Explain, referring to specific
aspects of the scatterplot.
Correct Answer:
Verified
View Answer
Unlock this answer now
Get Access to more Verified Answers free of charge
Q2: When using histograms to compare groups of
Q4: A numerical variable is continuous if it's
Q8: If the upper tail of a distribution
Q10: A time series plot is a graph
Q11: Information about the Spanish missions of Baja
Q15: A segmented bar chart uses rectangles rather
Q18: A unimodal set of data is one
Q18: The stem-and-leaf plot below displays the
Q19: One of the "media messages" sent
Q21: Marine biologists have reported the discovery of
Unlock this Answer For Free Now!
View this answer and more for free by performing one of the following actions

Scan the QR code to install the App and get 2 free unlocks

Unlock quizzes for free by uploading documents