The State Fisheries Department wishes to stock the Styx River with fish, and would like the
species to not only survive but thrive. The "substrate" (pebble size at bottom) of a river is an
important determinant of the quality of spawning habitat. Unknown to the Fisheries
officials, the pebble diameters in the Styx River are approximately normally distributed with
a mean of 24 mm, and a standard deviation of 8 mm. Fisheries officials will select a random
sample of pebbles in an attempt to estimate the average pebble size. a) On the scale below, sketch two curves, one representing the distribution of the original population and the other the sampling distribution of for a sample of size . Be sure to indicate which curve is which. What are the mean and standard deviation of the sampling distribution of ?  b) What is the approximate probability that a sample of n = 16 from this population would
result in a sample mean greater than 30 mm?
The graph below is a relative frequency histogram of the lengths of the gentle Hecate fish in the
Styx River, as recorded during a large fish tagging survey. You can assume that this histogram
represents the population of fish lengths. 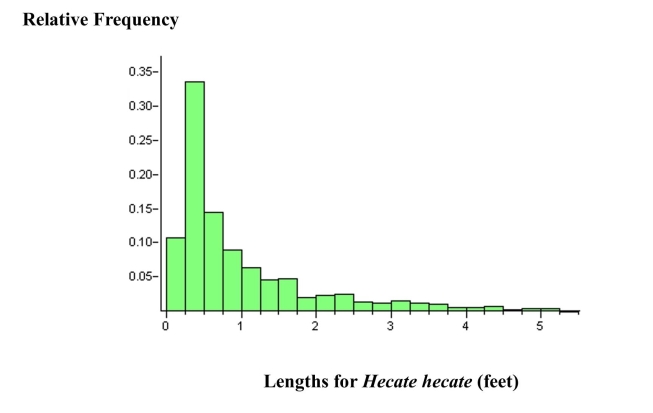 c) Suppose you were to take a random sample, n = 4, from this population of fish and
measure their lengths. Describe the shape, center, and spread of the sampling
distribution of x , as compared to the population distribution.
Correct Answer:
Verified
b)
\[\begin{array} { l }
z = \frac ...
View Answer
Unlock this answer now
Get Access to more Verified Answers free of charge
Q21: In a few sentences, describe the difference
Q21: In a few sentences, describe the difference
Q26: When performing hypothesis tests, there are assumptions
Q29: At the Billy Goat Gruff Inn,
Q30: A company provides portable walkie-talkies to
Q31: The department of natural resources classifies
Q32: T The foraging capability of Downy
Q33: Logging activity in forests is thought
Q35: A very large study of college
Q38: Describe in a few sentences how
Unlock this Answer For Free Now!
View this answer and more for free by performing one of the following actions

Scan the QR code to install the App and get 2 free unlocks

Unlock quizzes for free by uploading documents