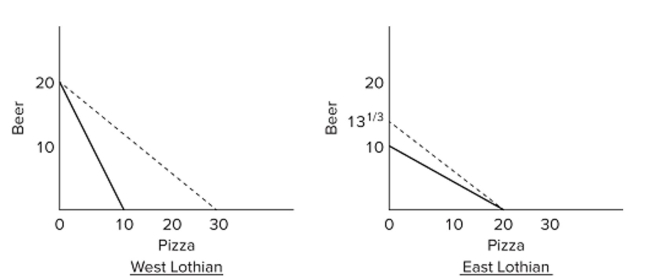
 In the accompanying diagrams, solid lines are production possibilities curves, and the dashed lines are trading possibilities curves. The trading possibilities curves suggest that the terms of trade are
A) 1.5 beers for 1 pizza.
B) 1 beer for 2 pizzas.
C) 2 beers for 1 pizza.
D) 1 beer for 1.5 pizzas.
Correct Answer:
Verified
Q28: Q29: Q30: Q31: Q32: The tables give production possibilities data Q34: Q35: If a nation has a comparative advantage Q36: The tables give production possibilities data Q37: In the theory of comparative advantage, a Q38: Unlock this Answer For Free Now! View this answer and more for free by performing one of the following actions Scan the QR code to install the App and get 2 free unlocks Unlock quizzes for free by uploading documents![]()
![]()
![]()
![]()
![]()

