Multiple Choice
 Refer to the diagram. Point b would be explained by
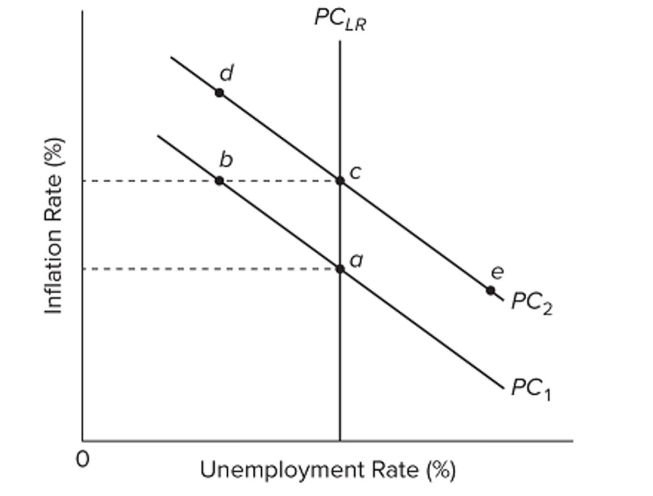
A) an actual rate of inflation that exceeds the expected rate.
B) an actual rate of inflation that is less than the expected rate.
C) cost-push inflation.
D) an increase in long-run aggregate supply.
Correct Answer:
Verified
Related Questions

