Multiple Choice
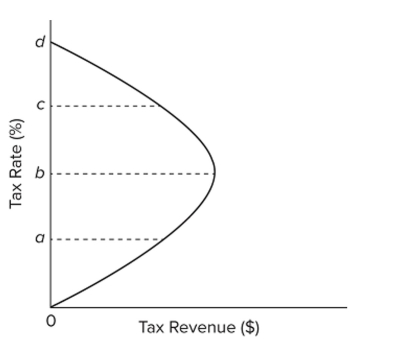 The graph describes the notion that as tax rates rise from zero percent, tax revenues will
A) increase at first, but then decline eventually as tax rates continue rising.
B) decrease at first, but then increase eventually as tax rates continue rising.
C) rise higher and higher.
D) fall lower and lower until they shrink to zero.
Correct Answer:
Verified
Related Questions
Q206: Most economists think that
A) supply-side effects of
Q207: One criticism against supply-side cuts in marginal
Q208: The idea that reductions in tax rates

