Multiple Choice
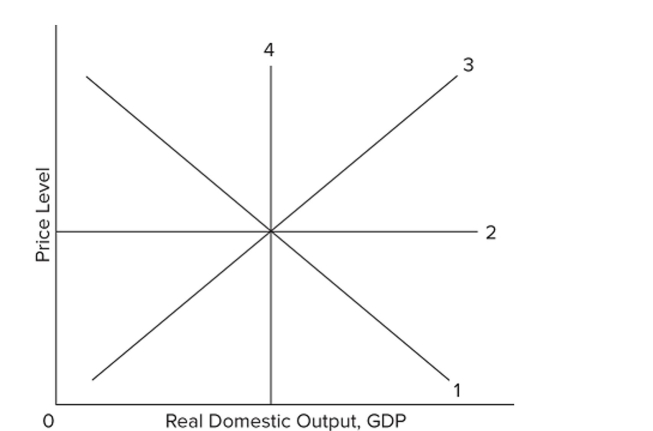 In the accompanying graph, the long-run aggregate supply curve would be represented by which line?
A) 1
B) 2
C) 3
D) 4
Correct Answer:
Verified
Related Questions
Q184: 1. Real-Balances Effect
2. Household Expectations
3. Interest-Rate
Q199: Q201: The short-run aggregate supply curve shows the Q202: If the price of crude oil decreased, Q203: A fall in the prices of inputs![]()
A)

