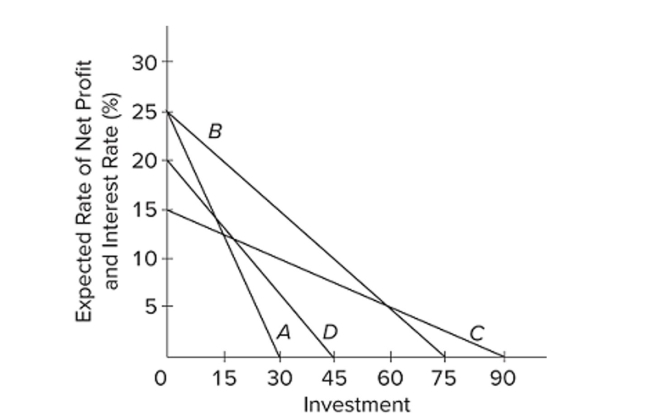
 Refer to the diagram. Assume that for the entire business sector of a private closed economy there is $0 worth of investment projects that will yield an expected rate of return of 25 percent or more. But
There are $15 worth of investments that will yield an expected rate of return of 20-25 percent; another
$15 with an expected rate of return of 15-20 percent; and an additional $15 of investment projects in
Each successive rate of return range down to and including the 0-5 percent range. Which of the lines
On the diagram represents these data?
A) A
B) B
C) C
D) D
Correct Answer:
Verified
Q119: The investment demand curve will shift to
Q120: Q121: Assume that for the entire business sector Q122: Investment spending in the United States tends
Unlock this Answer For Free Now!
View this answer and more for free by performing one of the following actions

Scan the QR code to install the App and get 2 free unlocks

Unlock quizzes for free by uploading documents