Multiple Choice
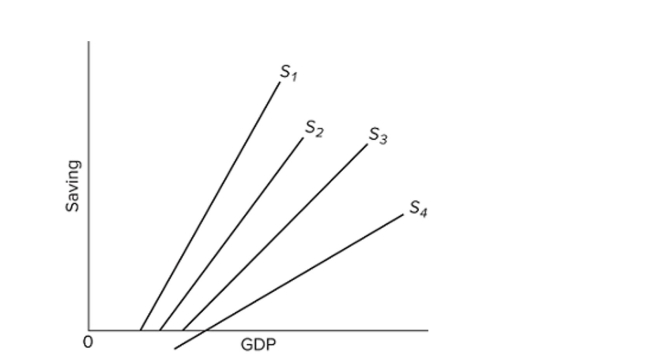 The figure shows the saving schedules for economies 1, 2, 3, and 4. Which economy has the highest marginal propensity to consume?
A) 1
B) 2
C) 3
D) 4
Correct Answer:
Verified
Related Questions
The figure shows the saving schedules for economies 1, 2, 3, and 4. Which economy has the highest marginal propensity to consume?
A) 1
B) 2
C) 3
D) 4
Correct Answer:
Verified

