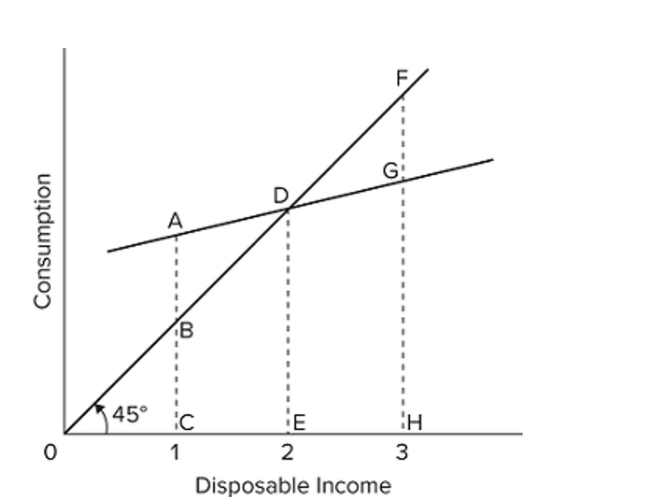
 Refer to the consumption schedule shown in the graph. As income falls from level 3 to level 2, the amount of
A) consumption increases and the amount of dissaving increases.
B) consumption decreases and the amount of dissaving decreases.
C) consumption decreases and the amount of saving decreases.
D) consumption decreases and the amount of saving increases.
Correct Answer:
Verified
Q184: Economists widely agree that the value of
Q185: The slope of the consumption schedule between
Q186: Personal saving is equal to
A) disposable income
Q187: As disposable income decreases, the
A) average propensity
Q188: As disposable income decreases, consumption
A) and saving
Q190: Q191: The amount of consumption in an economy Q192: If the MPC is 0.9 and investment Q193: The consumption schedule shows the relationship of Q194: ![]()
![]()
Unlock this Answer For Free Now!
View this answer and more for free by performing one of the following actions

Scan the QR code to install the App and get 2 free unlocks

Unlock quizzes for free by uploading documents