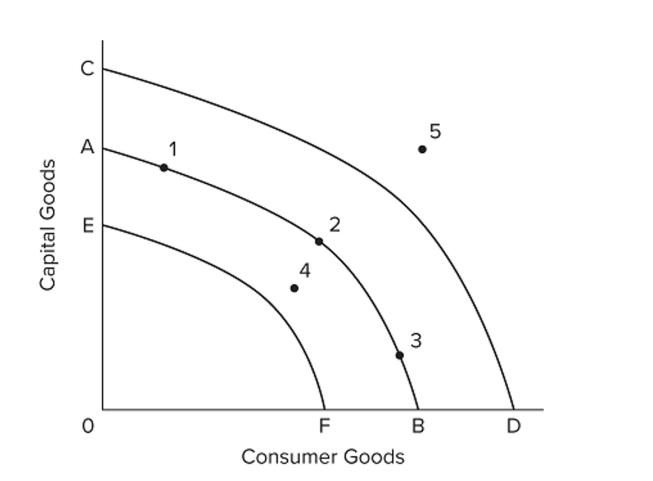
 Refer to the accompanying diagram. Which of the following is the most likely cause for a shift in the production possibilities curve from AB to CD?
A) the use of the economy's resources in a more efficient way
B) an increase in the spending of business and consumers
C) an increase in government purchases of the economy's output
D) an increase in the quantity and quality of labor resources
Correct Answer:
Verified
Q173: Assume that an economy has 1,500 workers,
Q174: Q175: Q176: Q177: Suppose that an economy is initially operating Q179: In the periods 1953-73 and 1973-95, U.S. Q180: A nation's real GDP will increase by Q181: In the U.S. economic-growth experience, Q182: What economic concept would be most closely Q183: In 2018, what approximate percentage of adults Unlock this Answer For Free Now! View this answer and more for free by performing one of the following actions Scan the QR code to install the App and get 2 free unlocks Unlock quizzes for free by uploading documents![]()
![]()
A) most capital

