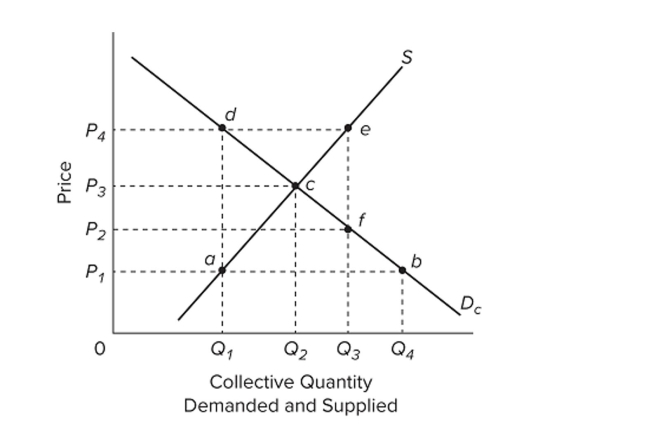
 Refer to the provided supply and demand graph for a public good. Point c on the graph shows where the
A) total benefit equals the total cost of the public good.
B) marginal benefit equals the marginal cost of the public good.
C) average benefit equals the average cost of the public good.
D) total benefit of the public good is at the maximum.
Correct Answer:
Verified
Q30: The market demand curve for a public
Q31: The following data are for a
Q32: Alex, Kara, and Susie are the only
Q33: What are the two characteristics that differentiate
Q34: The following data are for a
Q36: Cost-benefit analysis attempts to
A) compare the real
Q37: Among the following examples, the one that
Q38: According to the marginal-cost-marginal-benefit rule,
A) only government
Q39: Q40: ![]()
![]()
Unlock this Answer For Free Now!
View this answer and more for free by performing one of the following actions

Scan the QR code to install the App and get 2 free unlocks

Unlock quizzes for free by uploading documents