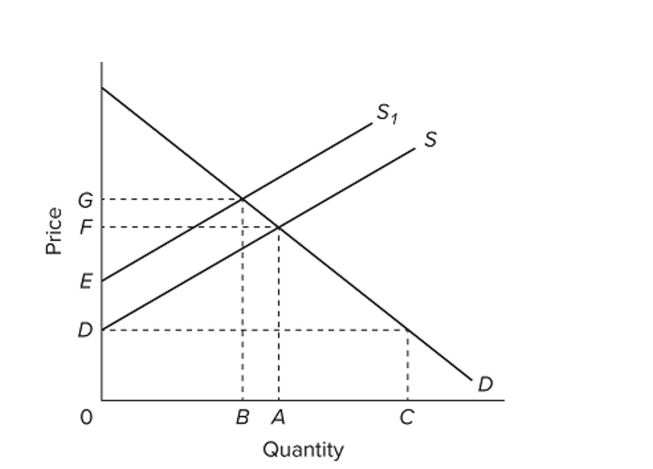
 Refer to the provided supply and demand graph for a product. In the graph, line S is the current supply of this product, while line S1 is the optimal supply from the society's perspective. This figure
Suggests that there is (are)
A) external benefits from the production of this product.
B) external costs in the production of this product.
C) currently an underallocation of resources toward producing this product.
D) positive externalities from producing the product.
Correct Answer:
Verified
Q133: When the production of a good generates
Q134: Q135: In a market where negative externalities are Q136: External benefits in consumption refer to benefits Q137: Where there are spillover (or external) benefits Q139: It is the custom for paper mills![]()
Unlock this Answer For Free Now!
View this answer and more for free by performing one of the following actions

Scan the QR code to install the App and get 2 free unlocks

Unlock quizzes for free by uploading documents