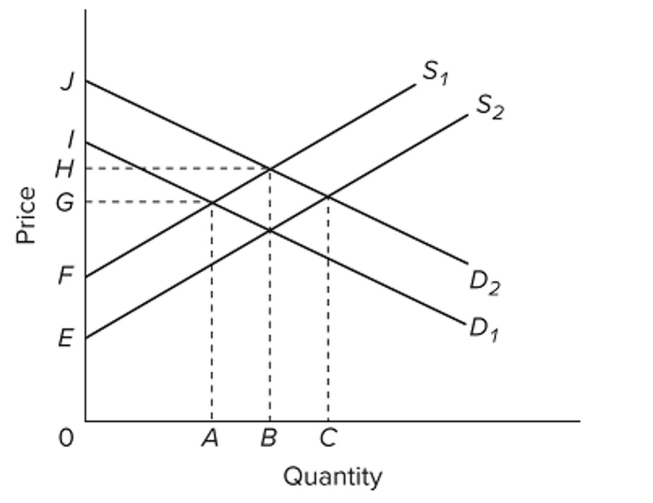
 Refer to the provided supply and demand graph. S1 and D1 represent the current market supply and demand, respectively. S2 and D2 represent the socially optimal supply and demand. The positions
Of the graphs indicate that there are
A) external benefits from production and external costs from consumption of the product.
B) external costs from production and external benefits from consumption of the product.
C) external benefits from production and consumption of the product.
D) external costs from production and consumption of the product.
Correct Answer:
Verified
Q123: Q124: It is the custom for paper mills Q125: Q126: If a good that generates negative externalities Q127: It is the custom for paper mills Q129: If there are external benefits associated with Unlock this Answer For Free Now! View this answer and more for free by performing one of the following actions Scan the QR code to install the App and get 2 free unlocks Unlock quizzes for free by uploading documents![]()
![]()

