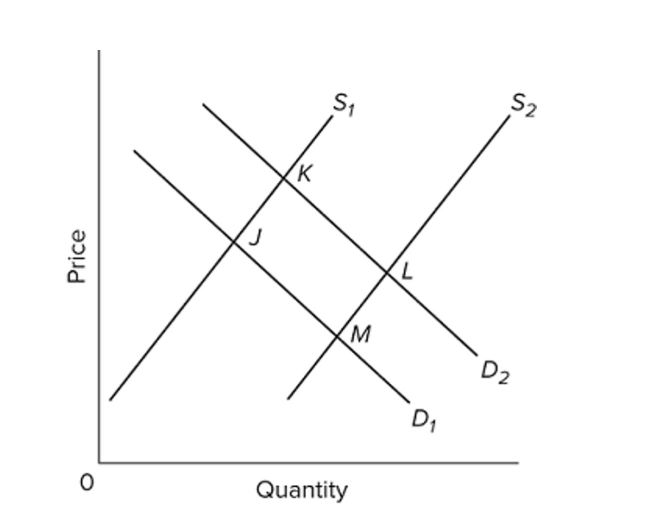
 Refer to the diagram, in which S1 and D1 represent the original supply and demand curves and S2 and D2 the new curves. In this market the indicated shift in demand may have been caused by
A) a decline in the number of buyers in the market.
B) a decline in the price of a substitute good.
C) an increase in incomes if the product is a normal good.
D) an increase in incomes if the product is an inferior good.
Correct Answer:
Verified
Q143: In the following question you are asked
Q144: Since their introduction, prices of Blu-ray players
Q145: In the following question you are asked
Q146: Data from the registrar's office at Gigantic
Q147: Q149: In the following question you are asked Q150: In the following question you are asked Q151: One can say with certainty that equilibrium![]()
Unlock this Answer For Free Now!
View this answer and more for free by performing one of the following actions

Scan the QR code to install the App and get 2 free unlocks

Unlock quizzes for free by uploading documents