Multiple Choice
The figure below shows three demand curves for coffee. 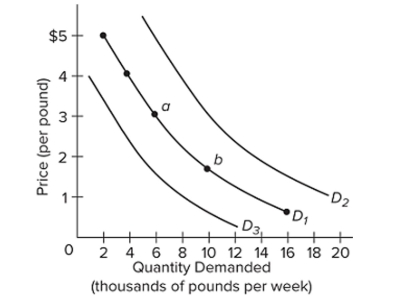 An increase in the price of coffee, other factors constant, would cause a
A) shift from D1 to D3.
B) shift from D1 to D2.
C) movement from point a to point b.
D) movement from point b to point a.
Correct Answer:
Verified
Related Questions
Q251: Suppose that goods A and B are
Q252: The figure below shows three demand curves
Q253: Which of the following will not cause
Q254: An increase in the price of product
Q255: Which of the following factors is a
Unlock this Answer For Free Now!
View this answer and more for free by performing one of the following actions

Scan the QR code to install the App and get 2 free unlocks

Unlock quizzes for free by uploading documents