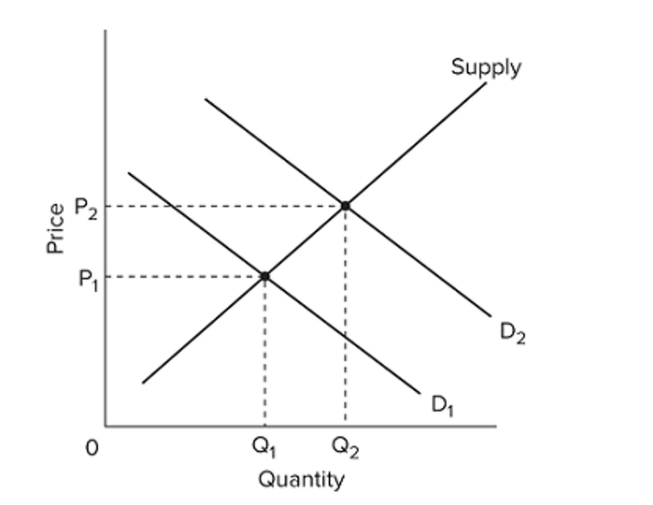
 Refer to the above graph showing the market for a product. Which of the following could not explain the indicated increase in equilibrium price from P1 to P2?
A) an increase in consumer incomes
B) an increase in production costs
C) a decrease in the price of a complementary product
D) an increase in the price of a substitute product
Correct Answer:
Verified
Q315: A television station reports that the price
Q316: Q317: When central planners in a command economy Q318: Sometimes, we observe cases where the price Q319: Which of the following statements is correct? Q321: Q322: What combination of changes would most likely Q323: Assume that the graphs show a competitive Q324: An increase in the demand for corn Q325: Unlock this Answer For Free Now! View this answer and more for free by performing one of the following actions Scan the QR code to install the App and get 2 free unlocks Unlock quizzes for free by uploading documents![]()

