Multiple Choice
Assume that the graphs show a competitive market for the product stated in the question. 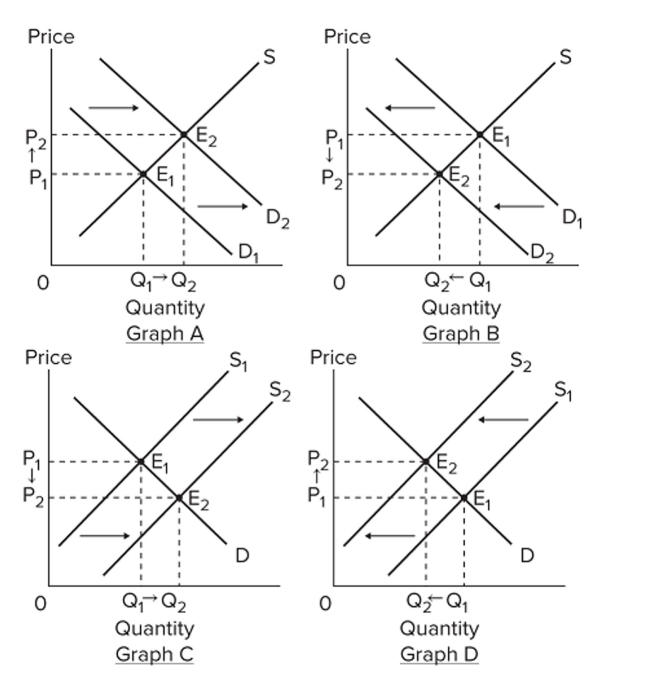 Select the graph above that best shows the change in the market specified in the following
Situation: the market for chicken, when the price of a substitute, such as beef, decreases.
A) Graph A
B) Graph B
C) Graph C
D) Graph D
Correct Answer:
Verified
Related Questions
Q297: The market system automatically corrects a surplus
Q298: A market for a product reaches equilibrium
Q299: If there was initially a shortage in
Unlock this Answer For Free Now!
View this answer and more for free by performing one of the following actions

Scan the QR code to install the App and get 2 free unlocks

Unlock quizzes for free by uploading documents