Multiple Choice
In the diagrams below, the subscript "1" refers to the initial position of the curve, while the subscript "2" refers to the final position after the curve shifts.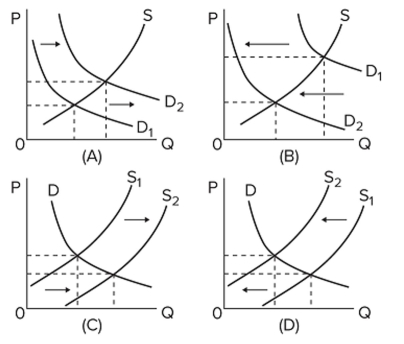 Which diagram illustrates the effects on the peanut butter market, if severe flooding destroys a large
Portion of the peanut crop in the economy?
A) A
B) B
C) C
D) D
Correct Answer:
Verified
Related Questions

