Multiple Choice
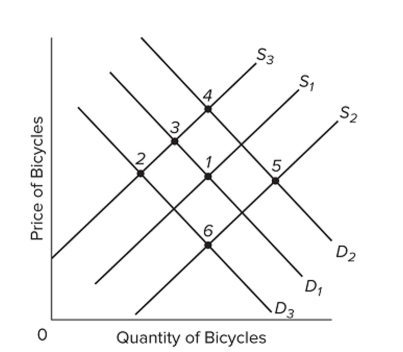 Refer to the above graph, which shows the market for bicycles. S1 and D1 are the original supply and demand curves. D2 and D3 and S2 and S3 are possible new demand and supply curves. Starting
From the initial equilibrium (point 1) , which point on the graph is most likely to be the new equilibrium
After the introduction of technological improvements in bicycle production and successful publicity
Campaigns by the government on the virtues of bicycling to work?
A) 3
B) 4
C) 5
D) 6
Correct Answer:
Verified
Related Questions
Q341: Q342: Q343: If a price ceiling is set below Q344: ![]()
![]()
![]()

