Multiple Choice
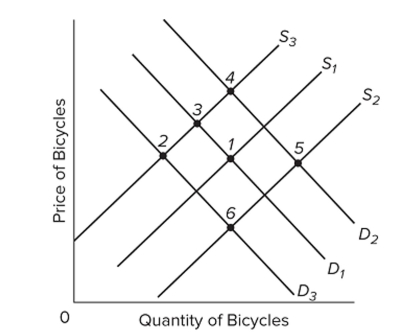 Refer to the above graph, which shows the market for bicycles. S1 and D1 are the original supply and demand curves. D2 and D3 and S2 and S3 are possible new demand and supply curves. Starting
From the initial equilibrium (point 1) , what point on the graph is most likely to be the new equilibrium
After a sharp increase in traffic accidents involving cyclists and the payment of subsidies to bicycle
Producers?
A) 3
B) 4
C) 5
D) 6
Correct Answer:
Verified
Related Questions

