The diagram shows the relationship between muscle tension and sarcomere length for muscle. Which point on the curve represents tension development at a normal resting length for skeletal muscle?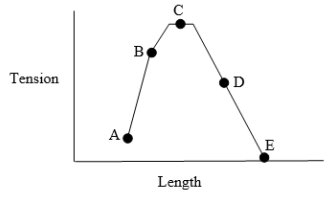
Correct Answer:
Verified
Q4: A 29-year-old woman has been training
Q5: The diagram shows force-velocity relationships for
Q6: High-frequency stimulation of a skeletal muscle causes
Q7: The diagram shows the relationship between contraction
Q8: When a person lifts a 25-pound weight,
Q10: The diagram shows the relationship between muscle
Q11: A 24-year-old medical student goes to the
Q12: The increase in muscle mass that typically
Q13: The color of a type I skeletal
Q14: The diagram shows the relationship between contraction
Unlock this Answer For Free Now!
View this answer and more for free by performing one of the following actions

Scan the QR code to install the App and get 2 free unlocks

Unlock quizzes for free by uploading documents