The figure given below depicts the negatively sloped demand and positively sloped supply curves of wheat in a country.
Figure 20.2
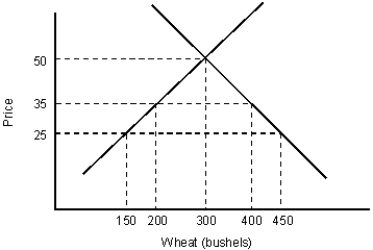
-In Figure 20.2, if the world price per bushel of wheat is $25, how much wheat will be imported?
A) 450 bushels
B) 350 bushels
C) 200 bushels
D) 150 bushels
E) 300 bushels
Correct Answer:
Verified
Q40: The figure below shows the demand (D)
Q41: The figure given below depicts the negatively
Q42: The figure below shows the demand (D)
Q43: The figure given below depicts the negatively
Q45: Suppose that the world price of kiwi
Q47: The figure below shows the demand (D)
Q48: The figure given below depicts the negatively
Q49: The figure given below depicts the negatively
Q50: The figure given below depicts the negatively
Q60: The figure given below depicts the negatively
Unlock this Answer For Free Now!
View this answer and more for free by performing one of the following actions

Scan the QR code to install the App and get 2 free unlocks

Unlock quizzes for free by uploading documents