The figure given below shows the demand curves for dollars arising out of Thai demand for U.S. goods and services and the supply of dollars arising out of the U.S. demand for Thai goods, services, and financial assets. D1 and S1 are the original demand and supply curves.
Figure 18.1
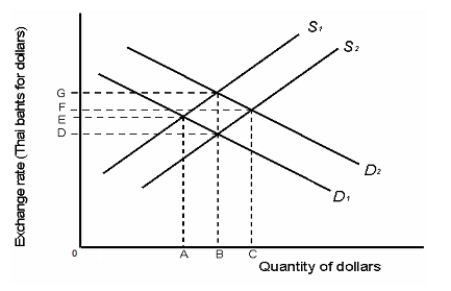
-Refer to Figure 18.1. The original equilibrium exchange rate is _____.
A) E
B) G
C) A
D) D
E) B
Correct Answer:
Verified
Q21: It is a known fact that the
Q23: Which of the following countries went through
Q25: What happened to the so-called Asian tigers
Q26: Which of the following is true of
Q31: The financial crises of the 1990s pointed
Q33: Which of the following countries had a
Q34: Which of the following is true of
Q35: Which of the following is one of
Q37: Which of the following is one of
Q38: Average growth of per capita GDP of
Unlock this Answer For Free Now!
View this answer and more for free by performing one of the following actions

Scan the QR code to install the App and get 2 free unlocks

Unlock quizzes for free by uploading documents