The figure given below shows the demand curves for dollars arising out of Thai demand for U.S. goods and services and the supply of dollars arising out of the U.S. demand for Thai goods, services, and financial assets. D1 and S1 are the original demand and supply curves.
Figure 18.2
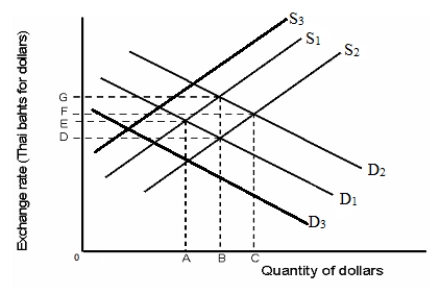
-Refer to Figure 18.2. Suppose investors predict that the value of Thai assets will decrease in the near future. This affects the current equilibrium exchange rate. To restore the original equilibrium, the Thai government intervenes in the foreign exchange market. How will this government action appear on the graph?
A) As a shift in the demand curve from D2 to D1
B) As a shift in the demand curve from D1 to D3
C) As a shift in the supply curve from S1 to S3
D) As a shift in the supply curve from S1 to S2
E) As a shift in the demand curve from D2 to D3
Correct Answer:
Verified
Q41: Refer to Figure 18.1.What would happen to
Q45: Refer to Figure 18.1.If there were a
Q46: Which of the following is a probable
Q47: Refer to Figure 18.1.Assume that there is
Q48: Globalization benefits all the participating nations equally.
Q52: The deleveraging of financial institutions led to
Q52: The figure given below shows the demand
Q54: Which of the following resulted in the
Q55: The financial crisis of 2007-2008 illustrated how
Q58: Generally, which of the following is the
Unlock this Answer For Free Now!
View this answer and more for free by performing one of the following actions

Scan the QR code to install the App and get 2 free unlocks

Unlock quizzes for free by uploading documents