The figure given below shows the Phillips curves of the U.S. economy during early 1960s to late 1970s.
Figure 14.2
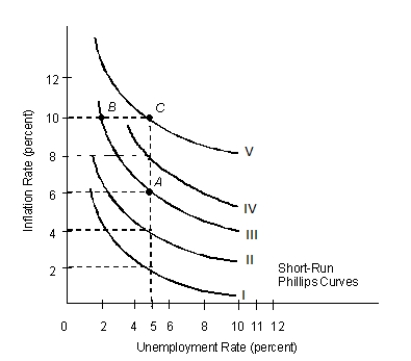
-Refer to Figure 14.2. If the natural rate of unemployment is 5 percent, which of the following would cause a movement along Phillips curve III from point A to point B?
A) An inward shift of the aggregate demand curve
B) An outward shift of the aggregate demand curve
C) A movement down along the aggregate supply curve
D) A movement down along the aggregate demand curve
E) A movement up along the aggregate demand curve
Correct Answer:
Verified
Q5: If the short-run Phillips curve shifts to
Q6: The slope of the short-run Phillips curve
Q10: The Phillips curve is named after the
Q11: The long-run aggregate supply curve at potential
Q11: The figure given below depicts the long
Q12: The figure given below shows the Phillips
Q13: The figure given below depicts the long
Q17: In the short run, a decline in
Q18: The Phillips curve based on the unemployment
Q19: The natural rate of unemployment is defined
Unlock this Answer For Free Now!
View this answer and more for free by performing one of the following actions

Scan the QR code to install the App and get 2 free unlocks

Unlock quizzes for free by uploading documents