The figure given below depicts the equilibrium exchange rate between the U.S dollar and the Mexican peso.
Figure 13.2
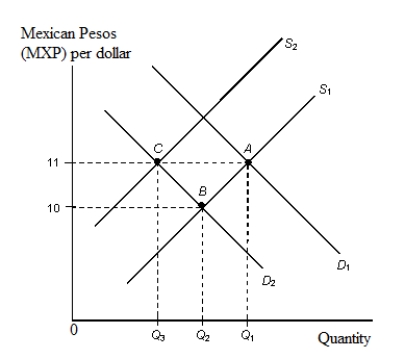
-Refer to Figure 13.2. Given a target exchange rate of MXP 11 = $1 with S1 the relevant supply curve and a decline in Mexican demand for U.S. dollars from D1 to D2 the Fed intervenes in the foreign exchange market by:
A) selling Q3 amount of pesos.
B) selling Q3 amount of U.S. dollars.
C) buying (Q2 - Q1) amount of pesos.
D) buying (Q1 - Q3) amount of U.S. dollars.
E) buying (Q2 - Q3) amount of U.S dollars.
Correct Answer:
Verified
Q64: Assume that the yen price of one
Q65: The use of domestic open market operations
Q67: The figure given below depicts the equilibrium
Q67: Which of the following is most likely
Q69: To keep the U.S.dollar from depreciating against
Q73: Which of the following people is most
Q74: The figure given below depicts the equilibrium
Q74: When more than one central bank attempts
Q78: To fix the foreign currency price of
Q99: Suppose the U.S.dollar appreciates in value against
Unlock this Answer For Free Now!
View this answer and more for free by performing one of the following actions

Scan the QR code to install the App and get 2 free unlocks

Unlock quizzes for free by uploading documents