In the figure given below panel A represents money market equilibrium, panel B represents investment demand, and panel C represents equilibrium real GDP.
Figure 13.3
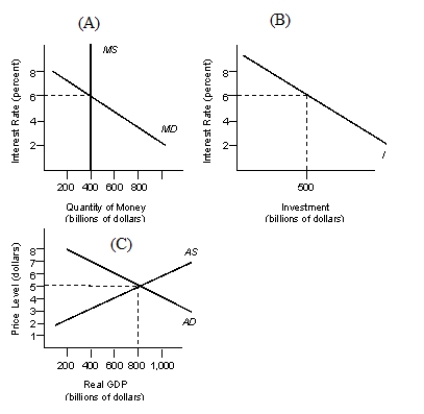
-Refer to Figure 13.3. Other things equal, if real GDP is equal to $900 billion, then:
A) the money demand curve will be to the left of the one shown in the figure above.
B) the quantity of money demanded will be less than $400 billion and can be illustrated by a downward movement along the money demand curve.
C) the quantity of money demanded will be greater than $400 billion and can be illustrated by an upward movement along the money demand curve.
D) the investment demand curve will be to the left of the one illustrated in Panel (A) of the figure.
E) the money demand curve will be to the right of the one illustrated in Panel (A) of the figure.
Correct Answer:
Verified
Q81: Suppose a bond sells for $2, 000
Q83: Scenario 13.1
Assume the following conditions hold.
a.At all
Q84: A change in the interest rate does
Q85: What is the current market price of
Q86: An excess demand for money will result
Q87: In the figure given below panel A
Q89: An increase in the money supply will
Q90: Suppose the interest rate on a bond
Q93: An increase in the money supply will:
A)decrease
Q98: Suppose that a sharp downturn in the
Unlock this Answer For Free Now!
View this answer and more for free by performing one of the following actions

Scan the QR code to install the App and get 2 free unlocks

Unlock quizzes for free by uploading documents