The figure given below shows the aggregate expenditure curve of an open economy.
Figure 10.1
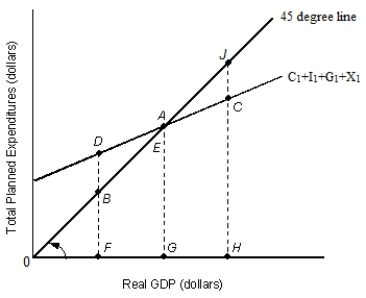 In the figure:
C1: Consumption
I1: Investment
G1: Government spending
X1: Net Exports
-According to Figure 10.1, the economy will expand when aggregate expenditures are at:
A) point D.
B) point A.
C) point B.
D) point C.
E) point E.
Correct Answer:
Verified
Q3: The table given below shows the
Q5: At the equilibrium level of income, which
Q6: The table given below states the
Q8: The equilibrium level of income will rise
Q10: The figure given below shows the aggregate
Q11: Which of the following can be considered
Q12: The table given below states the
Q14: In macroeconomics, equilibrium is defined as the
Q15: If aggregate expenditures are less than real
Q18: Assume that an economy is in equilibrium
Unlock this Answer For Free Now!
View this answer and more for free by performing one of the following actions

Scan the QR code to install the App and get 2 free unlocks

Unlock quizzes for free by uploading documents