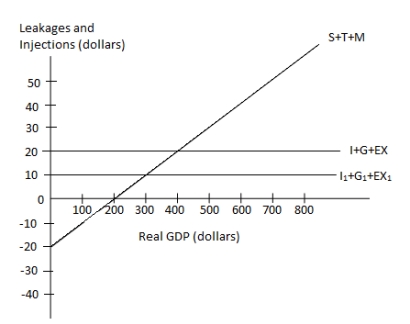
The figure given below represents the leakages and injections in an economy.
Figure 10.2
 In the figure:
I, I1: Investment;
G: Government spending;
EX, EX1: Exports;
T: Taxes; and
M: Imports.
-Refer to Figure 10.2. A decline in total injections by $10:
A) will cause equilibrium income to rise to $400.
B) will result in a disequilibrium of $200 in the economy.
C) will cause the total leakages curve to shift inward by $10.
D) will cause equilibrium income to fall to $300.
E) will not affect equilibrium income.
Correct Answer:
Verified
Q21: Assume that the marginal propensity to consume
Q24: At each round of the multiplier process,
Q25: Savings are good for a family.If all
Q32: Ceteris paribus, a downward shift in the
Q36: The figure given below represents the leakages
Q37: The figure given below represents the leakages
Q38: If Saving+Tax+Import > Investment+Government spending+Export, then _
Q41: Scenario 10.1
Imagine an economy that does not
Q42: The table given below reports the
Q43: The table given below reports the
Unlock this Answer For Free Now!
View this answer and more for free by performing one of the following actions

Scan the QR code to install the App and get 2 free unlocks

Unlock quizzes for free by uploading documents