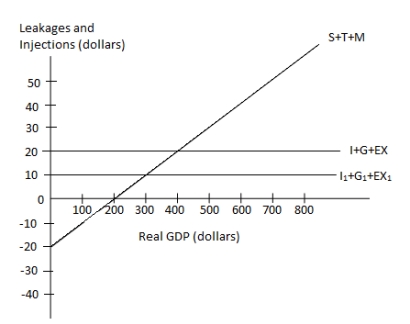
The figure given below represents the leakages and injections in an economy.
Figure 10.2
 In the figure:
I, I1: Investment;
G: Government spending;
EX, EX1: Exports;
T: Taxes; and
M: Imports.
-Refer to Figure 10.2. Suppose that I+G+EX equals $20 and the economy is in equilibrium. What is the amount of saving when T = $0 and M = $5 at the equilibrium level?
A) $0
B) $10
C) $15
D) $20
E) $25
Correct Answer:
Verified
Q22: Suppose in an economy, investment = $40,
Q24: At each round of the multiplier process,
Q25: Scenario 10.1
Imagine an economy that does not
Q27: Scenario 10.1
Imagine an economy that does not
Q29: Assume that an increase of $300 in
Q31: The figure given below represents the leakages
Q32: Ceteris paribus, a downward shift in the
Q36: Suppose an economy has a government budget
Q37: The spending multiplier measures the change in
Q38: If Saving+Tax+Import > Investment+Government spending+Export, then _
Unlock this Answer For Free Now!
View this answer and more for free by performing one of the following actions

Scan the QR code to install the App and get 2 free unlocks

Unlock quizzes for free by uploading documents