The figure given below represents the macroeconomic equilibrium in the aggregate income and aggregate expenditure framework. Assume that MPI is equal to zero.
Figure 10.4
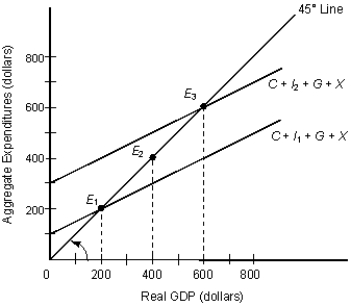 In the figure:
C: Consumption
I1 and I2: Investment
G: Government Spending
X: Exports
-Refer to Figure 10.4. Starting at equilibrium level E3 equilibrium level E1 will be reached if aggregate expenditure:
A) decreases by $200.
B) increases by $200.
C) decreases by $100.
D) increases by $100.
E) increases by $50.
Correct Answer:
Verified
Q60: Scenario 10.1
Imagine an economy that does not
Q61: Assume that potential GDP is $200 billion
Q61: The figure given below shows the macroeconomic
Q62: The figure given below depicts macroeconomic equilibrium
Q63: The figure given below depicts macroeconomic equilibrium
Q66: The table given below shows the
Q67: The figure given below represents the macroeconomic
Q68: Calculate the marginal propensity to save for
Q69: The figure given below represents the macroeconomic
Q70: The table given below shows the
Unlock this Answer For Free Now!
View this answer and more for free by performing one of the following actions

Scan the QR code to install the App and get 2 free unlocks

Unlock quizzes for free by uploading documents