The figure given below shows the macroeconomic equilibrium of a country.
Figure 10.7
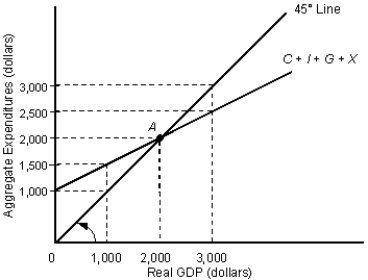
-Given a potential GDP level of $3,000, the recessionary gap in Figure 10.7 equals _____.
A) $3,000
B) $2,500
C) $1,500
D) $500
E) $100
Correct Answer:
Verified
Q78: The figure given below represents the macroeconomic
Q79: Calculate the spending multiplier from the information
Q80: The figure given below represents the macroeconomic
Q83: Which of the following will not increase
Q84: When the purchasing power of money declines:
A)demand
Q86: The spending multiplier equals 1/marginal propensity to
Q87: Suppose an appreciation of the French franc
Q90: The interest rate effect states that an
Q95: If 81 percent of Canada's exports go
Q97: Assume that the multiplier effect for Mexico
Unlock this Answer For Free Now!
View this answer and more for free by performing one of the following actions

Scan the QR code to install the App and get 2 free unlocks

Unlock quizzes for free by uploading documents