The figure given below shows the consumption function of a household.
Figure 9.2
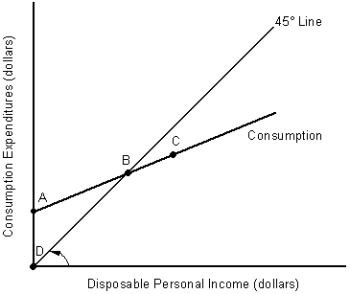
-In Figure 9.2, the line segment AD represents:
A) autonomous consumption.
B) the maximum amount of saving.
C) negative consumption.
D) zero consumption.
E) autonomous income.
Correct Answer:
Verified
Q23: Suppose total disposable income in Country X
Q29: The figure given below represents the consumption
Q30: The figure given below represents the consumption
Q31: The figure given below represents the consumption
Q33: The table given below reports the
Q35: The figure given below represents the consumption
Q36: The figure given below shows the consumption
Q37: The figure given below represents the consumption
Q38: The figure given below shows the consumption
Q39: The figure given below shows the consumption
Unlock this Answer For Free Now!
View this answer and more for free by performing one of the following actions

Scan the QR code to install the App and get 2 free unlocks

Unlock quizzes for free by uploading documents