The figure given below represents the long-run equilibrium in the aggregate demand and aggregate supply model.
Figure 8.2
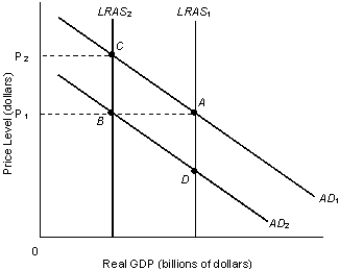
-Refer to Figure 8.2. Suppose major oil-exporting countries restrict oil output, thus increasing the price of oil. This would be represented by:
A) a movement from A to C.
B) a movement from A to B to C.
C) a movement from B to C.
D) a movement from B to A.
E) a movement from C to A.
Correct Answer:
Verified
Q81: The interest rate effect suggests that investment
Q83: An increase in aggregate demand normally does
Q84: A change in foreign demand does not
Q87: Government spending is set by the federal
Q90: An increase in the real value of
Q91: The purchase of fifty new food-processing machines
Q91: The figure given below represents the equilibrium
Q93: The figure given below represents the equilibrium
Q95: The figure given below represents the equilibrium
Q100: In 2009, a nation reported total imports
Unlock this Answer For Free Now!
View this answer and more for free by performing one of the following actions

Scan the QR code to install the App and get 2 free unlocks

Unlock quizzes for free by uploading documents