The figure given below represents the long-run equilibrium in the aggregate demand and aggregate supply model.
Figure 8.2
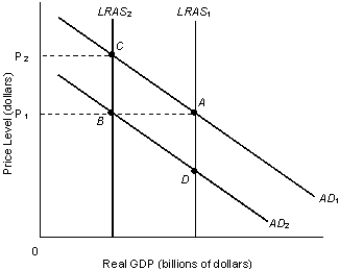
-Refer to Figure 8.2. A movement from equilibrium point A to equilibrium point B would be the result of a(n) :
A) increase in consumer confidence and a decrease in productivity.
B) technological advances and domestic price decreases.
C) decrease in productivity and a decrease in government spending.
D) increase in production costs and greater consumer confidence.
E) decrease in domestic prices and decrease in direct taxes.
Correct Answer:
Verified
Q70: Suppose in Country X, wages of workers
Q80: The movement of the vertical _ curve
Q83: The figure given below represents the equilibrium
Q83: An increase in aggregate demand normally does
Q84: A change in foreign demand does not
Q85: A demand-pull inflation is caused by an
Q87: Government spending is set by the federal
Q90: An increase in the real value of
Q91: The purchase of fifty new food-processing machines
Q92: The economic reasons that underlie the shape
Unlock this Answer For Free Now!
View this answer and more for free by performing one of the following actions

Scan the QR code to install the App and get 2 free unlocks

Unlock quizzes for free by uploading documents