The figure given below represents the equilibrium real GDP and price level in the aggregate demand and aggregate supply model.
Figure 8.3
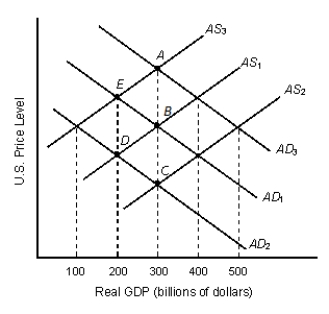
-Refer to Figure 8.3. If AS1 and AD1 represent the initial aggregate demand and supply in the economy, the long-run equilibrium real GDP will be _____ billion.
A) $100
B) $200
C) $300
D) $400
E) $500
Correct Answer:
Verified
Q89: Increased household spending reduces aggregate expenditures.
Q93: A rightward shift in the aggregate supply
Q94: If there is a sudden jump in
Q95: The figure given below represents the equilibrium
Q98: A lower domestic price level raises aggregate
Q101: If people expect the economy to do
Q107: If the aggregate supply curve is vertical,
Q113: Suppose an increase in investment spending results
Q115: If a large number of laborers shift
Q116: In the short run, a decrease in
Unlock this Answer For Free Now!
View this answer and more for free by performing one of the following actions

Scan the QR code to install the App and get 2 free unlocks

Unlock quizzes for free by uploading documents