he figure given below represents the business cycle of an economy.
Figure 7.1
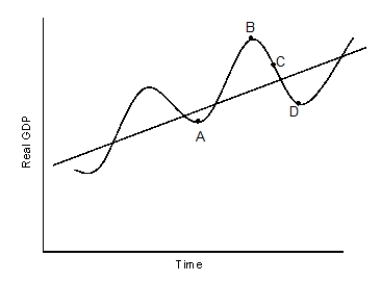
-Refer to Figure 7.1. The movement from point A to point B in the figure is most likely to be associated with _____.
A) negative inflation rates.
B) an increase in the aggregate demand for goods and services.
C) lagging economic productivity.
D) an increase in cyclical unemployment.
E) a downward trend in leading economic indicators.
Correct Answer:
Verified
Q3: Economists call a severe prolonged economic recession
Q10: Which of the following is not a
Q13: Which of the following signals the start
Q16: Which of the following would be considered
Q18: Which of the following will be considered
Q21: Scenario 7.2
Suppose it has been recently predicted
Q22: Scenario 7.1
Of 1,350 people surveyed, 318 are
Q22: In the official labor statistics, discouraged workers
Q23: To be counted as part of the
Q32: Suppose Jess resigns from her low paying
Unlock this Answer For Free Now!
View this answer and more for free by performing one of the following actions

Scan the QR code to install the App and get 2 free unlocks

Unlock quizzes for free by uploading documents