The figure given below represents the demand and supply conditions of an economy.
Figure 7.3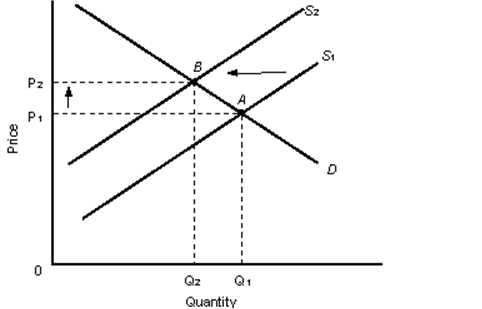
-Refer to Figure 7.3. Which of the following explains the shift in supply curve from S1 to S2?
A) decreases in oil supplies as experienced in the 1970s.
B) wage concessions by union members.
C) businesses reducing their profit margins.
D) discoveries of natural gas.
E) increased foreign demand for domestic products.
Correct Answer:
Verified
Q67: When the real interest rate is less
Q82: Other things equal, the equation for the
Q84: Assume you borrow $1, 000 on credit
Q87: Which if the following is most likely
Q88: When there is an upward rise in
Q89: If increases in total spending are not
Q92: During a period of economic expansion, we
Q97: A variable-rate mortgage:
A)eliminates the risk of expected
Q98: Which of the following countries experienced hyperinflation
Q100: If the nominal interest rate is 6.3
Unlock this Answer For Free Now!
View this answer and more for free by performing one of the following actions

Scan the QR code to install the App and get 2 free unlocks

Unlock quizzes for free by uploading documents