The figure given below represents the equilibrium price and output in the market for restaurant meals and delivery meals.
Figure 4.1
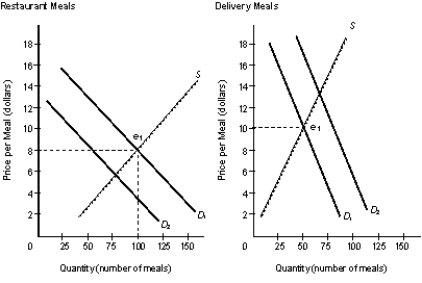
-Refer to Figure 4.1. The demand for Restaurant Meals shift in one direction while the demand for Delivery meals shift in another direction. This implies:
A) the demand for Restaurant Meals increased while that for Delivery Meals decreased.
B) the demand for Restaurant Meals decreased while that for Delivery Meals increased.
C) the demand for Restaurant Meals increased while that for Delivery Meals increased.
D) the demand for Restaurant Meals decreased while that for Delivery Meals decreased.
E) the demand for Restaurant Meals and the demand for Delivery Meals adds up to 1.
Correct Answer:
Verified
Q2: Which of the following correctly describes the
Q5: 'Walkmans' that played audio cassettes were withdrawn
Q6: The market process by which new products
Q7: The idea that in a market system
Q10: The figure given below represents the equilibrium
Q12: The figure given below represents the equilibrium
Q14: The figure given below represents the equilibrium
Q15: The figure given below represents the equilibrium
Q16: Mark's ability to purchase goods and services
Q20: Identify the correct reason behind the rise
Unlock this Answer For Free Now!
View this answer and more for free by performing one of the following actions

Scan the QR code to install the App and get 2 free unlocks

Unlock quizzes for free by uploading documents