Examine the graph below.
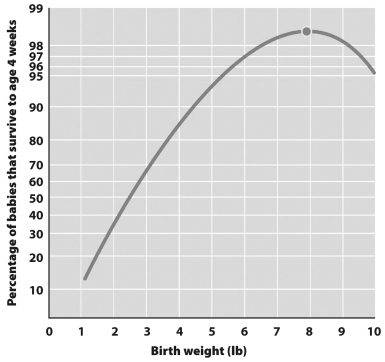
The shape of this graph indicates that birth weight in human babies is an example of _____________ selection.
Correct Answer:
Verified
Q45: When a population shrinks, causing low genetic
Q48: In many cases of _ selection, mates
Q51: Although they are protected in many countries,
Q53: In the Hardy-Weinberg equation, _ represents the
Q54: Two populations of geese live near each
Q56: A few members of a species establish
Q72: Mutations generally cause rapid changes in allele
Q74: Allele frequency refers to the rate of
Q75: Larger male elephant seals have more mates
Q79: A new allele spreads from one large
Unlock this Answer For Free Now!
View this answer and more for free by performing one of the following actions

Scan the QR code to install the App and get 2 free unlocks

Unlock quizzes for free by uploading documents