This figure depicts blood pressure in different regions of the body as a result of the contraction and relaxation of the left ventricle. 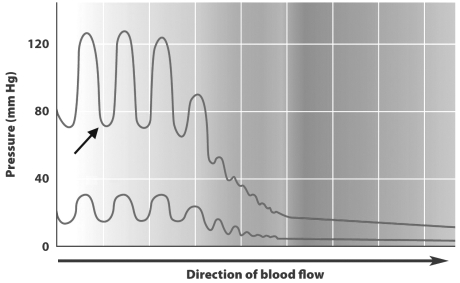
The arrow indicates the amount of pressure in the ______________ of the left ventricle.
A) lungs during systole
B) systemic arteries near the heart during diastole
C) lungs during diastole
D) systemic arteries near the heart during systole
Correct Answer:
Verified
Q20: Which of the following blood pressures would
Q21: The pressure needed to move blood from
Q22: The figure below shows how a pacemaker
Q23: Arteries and veins, which transport materials over
Q24: Which of the following is not a
Q26: Which of the following would have an
Q27: Which of the following statements about open
Q28: All animals with closed circulatory systems have
Q29: Excess cholesterol can cause sticky deposits to
Q30: Which of the following is not a
Unlock this Answer For Free Now!
View this answer and more for free by performing one of the following actions

Scan the QR code to install the App and get 2 free unlocks

Unlock quizzes for free by uploading documents