The graph below shows the levels of gonadotropins throughout the menstrual cycle.
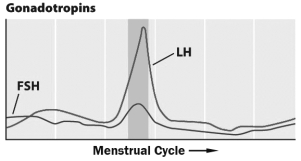
The darker gray region of the graph corresponds to the period when __________ occurs in the ovaries.
Correct Answer:
Verified
Q43: When liver cells are unable to respond
Q44: The 28-day menstrual cycle is regulated by
Q44: Birth control pills prevent pregnancy by maintaining
Q45: In a human male,the _ secrete hormones
Q46: Because steroid hormones are _,they are able
Q51: During menopause, lower levels of estrogen cause
Q52: The beginning of _ is marked by
Q57: Parathyroid hormone is released into the blood
Q57: Four to six weeks after conception,sex hormones
Q70: A single hormone can have different effects
Unlock this Answer For Free Now!
View this answer and more for free by performing one of the following actions

Scan the QR code to install the App and get 2 free unlocks

Unlock quizzes for free by uploading documents